A Look At Lollapalooza 2014
31 Jul 2014I was in high school when my friend and I decided to attend our first music festival. It was a rainy August day that was somehow sweltering and uncomfortable in a way only Chicago can produce. My friend and I stepped up to the ticket window outside Grant Park and ordered our three day passes at the door.
There have been a few Lollapaloozas since that day, and in the time since, music festivals have exploded in popularity. Tickets this year sold out in record time and my hopes of getting even a one day were dashed by Europe’s lack of Wi-Fi and Sprint’s outrageous international data prices. In lieu of participating in three days of Chicago’s biggest music festival, I decided to take a look at some of the data behind Lollapalooza instead.
Getting the Data
The Lollapalooza website offers a good summary of the bands, as well as allows fans to create their own schedules. Each artist’s page shows how many fans have signed up, allowing us to get a good (albeit biased) view of an artist’s estimated attendance. I created a web scraper in Python, using the beautiful soup module to make the HTML parsing easier.
While the data on the website is nice, I wanted more information about each artist. Armed with a JSON file of artists and Lolla’s data (including fans, set times, and stage), I used The Echonest API to request additional metadata for each band. The Echonest is a fantastic company (based in my college town of Somerville), and their API offers an extensive set of metrics for both musical acts and individual songs.
A Look at Genres
Disclaimer: Nothing gets a bunch of music geeks angrier than someone trying to classify a bunch of hipster bands into genres. Bear with me on my classifications and feel free to argue in the comments.
The Echonest API offers a “terms” property that returns a list of genres sorted by how strongly they correspond to an artist. For each artist I took the top two from this list. I started by looking at the top words across all artists:
Top Words to Describe Artists:
- 75: rock
- 63: indie
- 36: pop
- 20: electronic
- 17: dance
- 16: alternative
- etc…
As we can see, indie and rock are well represented at the top. However, this picture may be distorted because many genres are compounds (such as indie rock). If we switch from words to phrases we get a similar but slightly different picture. In technical terms, we have switched from a bag of words model to a vector space model. While bag of words represents each word separately, the vector space model is more generic and allows us to represent terms as multiple words:
Top Genres:
- 33: rock
- 26: indie
- 23: indie rock
- 21: pop
- 20: electronic
- 17: dance
- etc…
At the top, things look mostly the same. Pop is under-represented, however, owing to the large number of pop subgenres. It’s hard to truly get a feel of the larger “macro genres” at the festival using either of these models. I decided to classify (by hand) each genre into one or two of seven overarching genres. I used the fantastic RAW tools to create an alluvial diagram of how each genre corresponds to its larger parent:
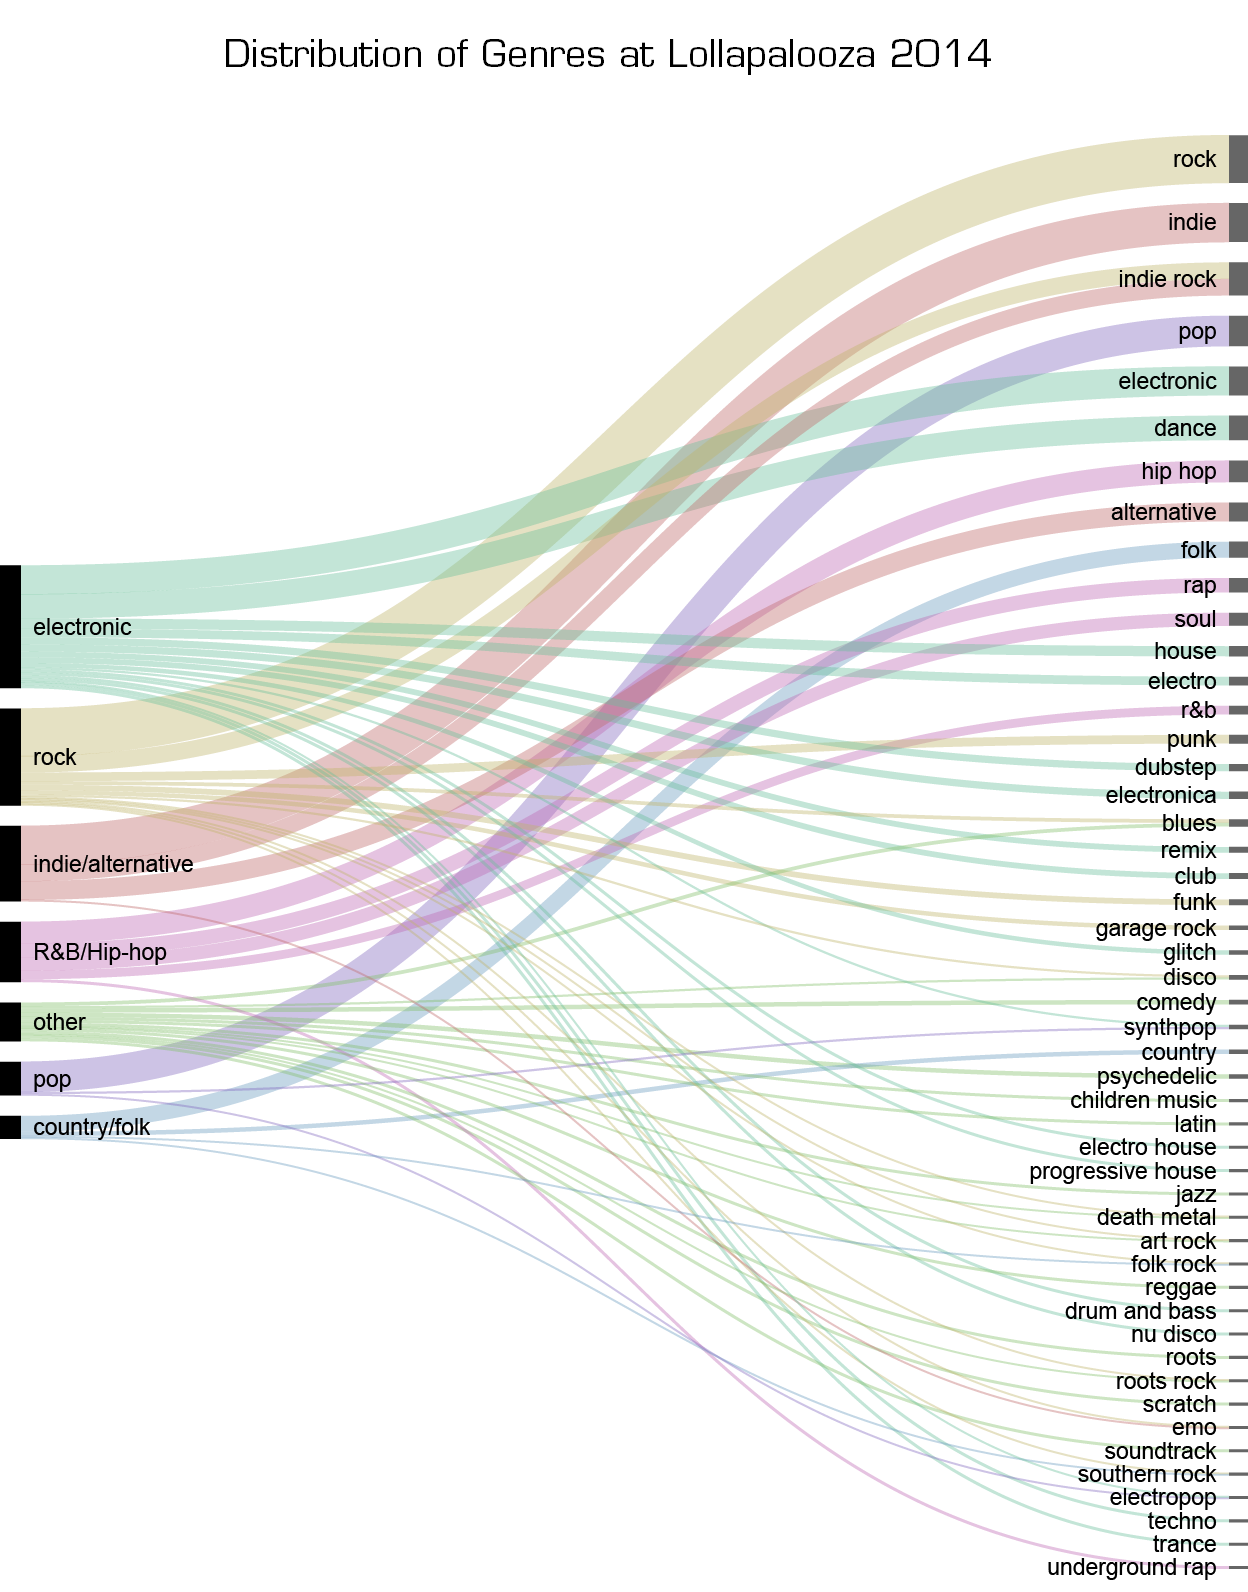
In this case, the picture changes quite a bit. The multitude of different electronic genres sends the “electronic” category skyrocketing into first place. While my classification of genres obviously has significant sway on these rankings (who is to say all dance music is electronic), this view is consistent with the rise of EDM and the popularity of the DJ stage Perry’s at the festival.
A Look at Popularity
Artist popularity is a fickle thing - when I was in charge of concerts at Tufts a band could sell out popular dates in a few days if they hit it big on the radio. Talent management at Lollapalooza tries their best to extrapolate a band’s pull, but booking months in advance leaves room for error. This is part of the reason the schedule is released so late - organizers don’t know for sure which bands will be popular when they book.
The Echonest offers two metrics of a band’s popularity - hotttnesss (yes spelled like that), and familiarity. Hotttness refers to the band’s instantaneous popularity based on blogs and music websites, while familiarity refers to a band’s popularity over time. In most cases the two are heavily correlated, but for older bands past their prime familiarity may far surpass popularity.
Based on these two metrics and number of fans attending a given show, we can see the top bands in each category (bold denotes headliners):
Top ten artists by number of fans on Lollapalooza.com
- Lorde
- Arctic Monkeys
- Outkast
- Foster The People
- Eminem
- Kings of Leon
- Cage The Elephant
- Calvin Harris
- Young the Giant
- GROUPLOVE
Top ten artists by hotttnesss via Echonest
- Calvin Harris
- Iggy Azalea
- Lorde
- Eminem
- Arctic Monkeys
- Duke Dumont
- Vance Joy
- Martin Garrix
- Zedd
- Skrillex
Top ten artists by familiarity via Echonest
- Eminem
- Nas
- Arctic Monkeys
- Outkast
- Kings of Leon
- Skrillex
- Calvin Harris
- Interpol
- The Kooks
- AFI
It seems festival organizers did pretty well. There is an understandable bias towards the more familiar artists over more immediately popular ones - organizers have no way to know who will be hottest come August and the more familiar the artist the safer choice they are. One interesting observation is that Lorde is the most popular according to Lolla fans. In terms of numbers, Lorde overshadows her headliner stage-mate The Arctic Monkeys (who are also rated quite high), although admittedly not by much. I suspect this discrepancy is due to Lorde’s continued radio success combined with her lack of American tour dates. Get to this stage early if you want any chance of a good seat for either band.
One question I had starting this analysis was whether or not Lolla’s fan base would have more esoteric (read: hipster) music tastes than the general population that Echonest is supposed to represent. I cynically believed that based on its massive popularity, Lollapalooza would in fact sway the other direction. By normalizing both fan numbers and hotttnesss (or familiarity) and plotting them against each other we can hopefully see if there is a difference.
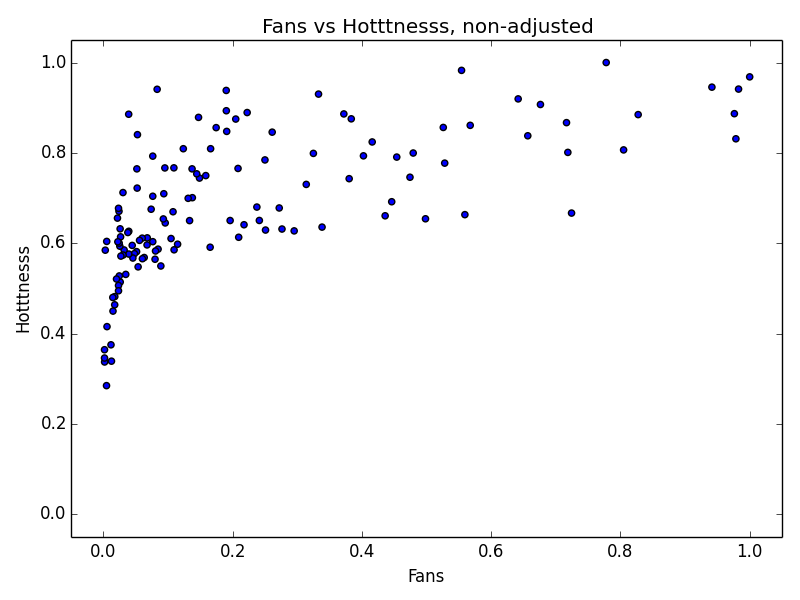
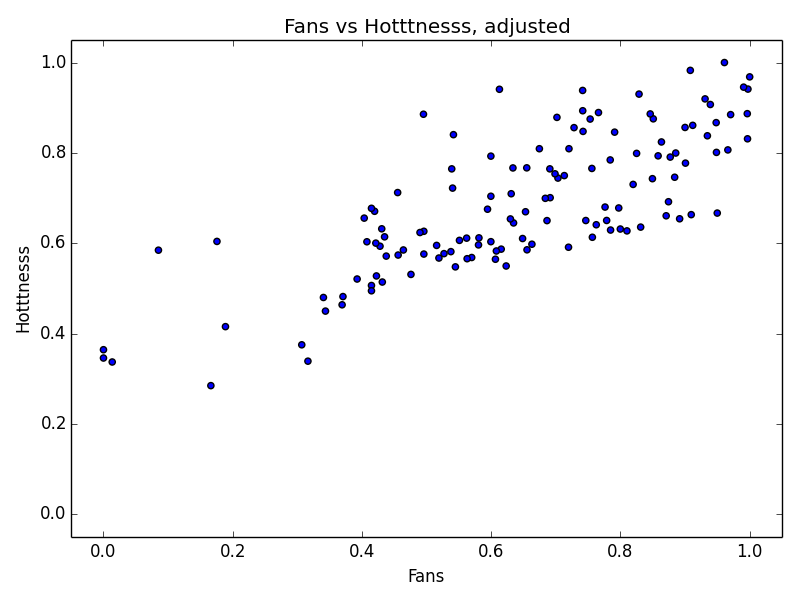
Whoops. It looks like somewhere in The Echonest’s calculations they compress their scale, leading to the plot above. I took the logarithm of the fans and used that instead and got a much better result.
I fit a line to this data, as well as plotted one standard deviation above and below. The data points are color coded based on the (Euclidian) distance from the model, and the five largest outliers labeled.
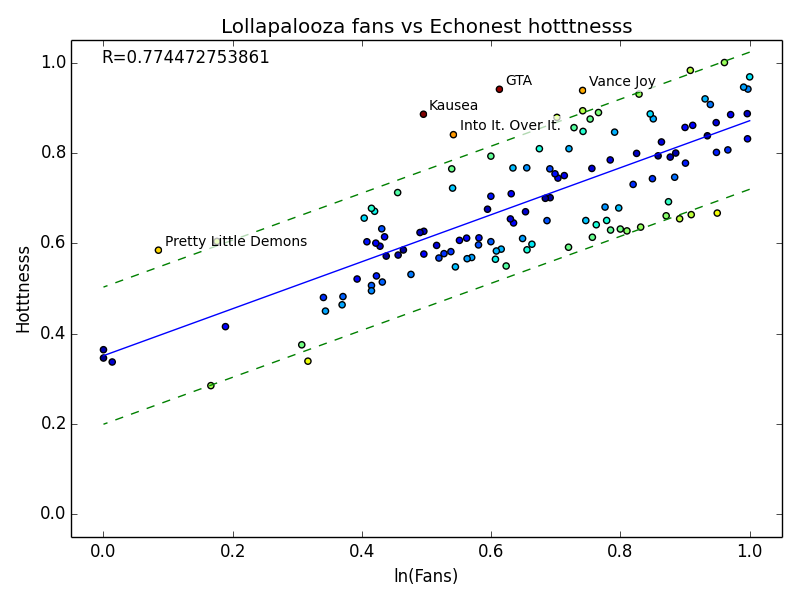
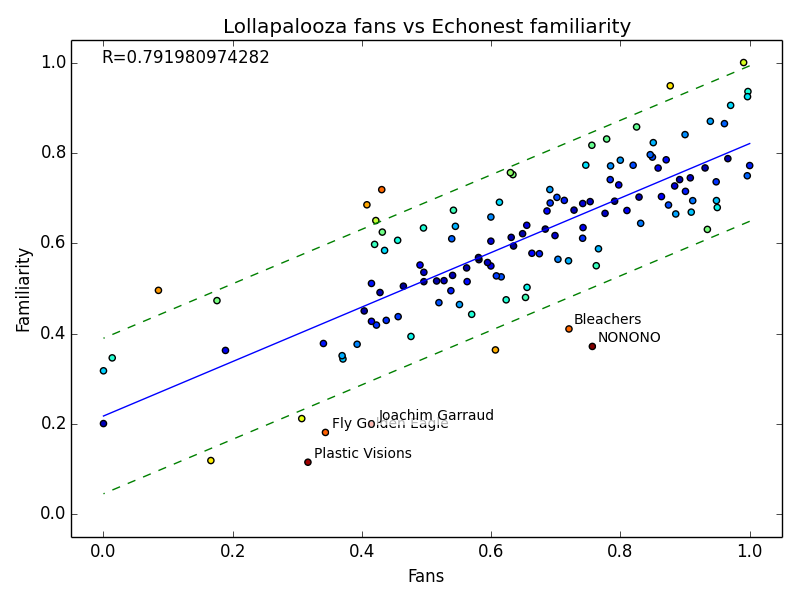
In general the number of Lollapalooza fans is proportional to Echonest’s estimated popularity for both hotttnesss and familiarity. Fans tend to underattend the hotter concerts but overattend the less familiar, but for the most part stay within one standard deviation of the expectation. Although it’s only by a bit, we could potentially conclude that Lollapalooza is a bit more hipster than the Echonest public.
Disclaimers and Future Projects
Any data based project has to make assumptions about the population they are sampling. In this case, I assume that the Lollapalooza fans listed online accurately represents the entire population. This may not be the case - I know I never made a custom schedule when I attended Lolla so I’m not sure who does. It may correspond to a specific demographic or fans.
I’d love to have a second look at music festivals in general. One thing in particular I’d like to do is to look at a spectrum of music festivals across the nation and use document similarity techniques to try and create a plot of events based on how alike they are (either by bands or genres). The biggest hurdle for this is finding or creating a dataset with all the bands at each festival - I couldn’t find one online and each website is different making scraping difficult.
This is the first post in my new blog, and although I’ll be starting a busy school year soon, hopefully I’ll be able to do more these write-ups in the future. Feel free to leave questions or methodology complaints in the comments.